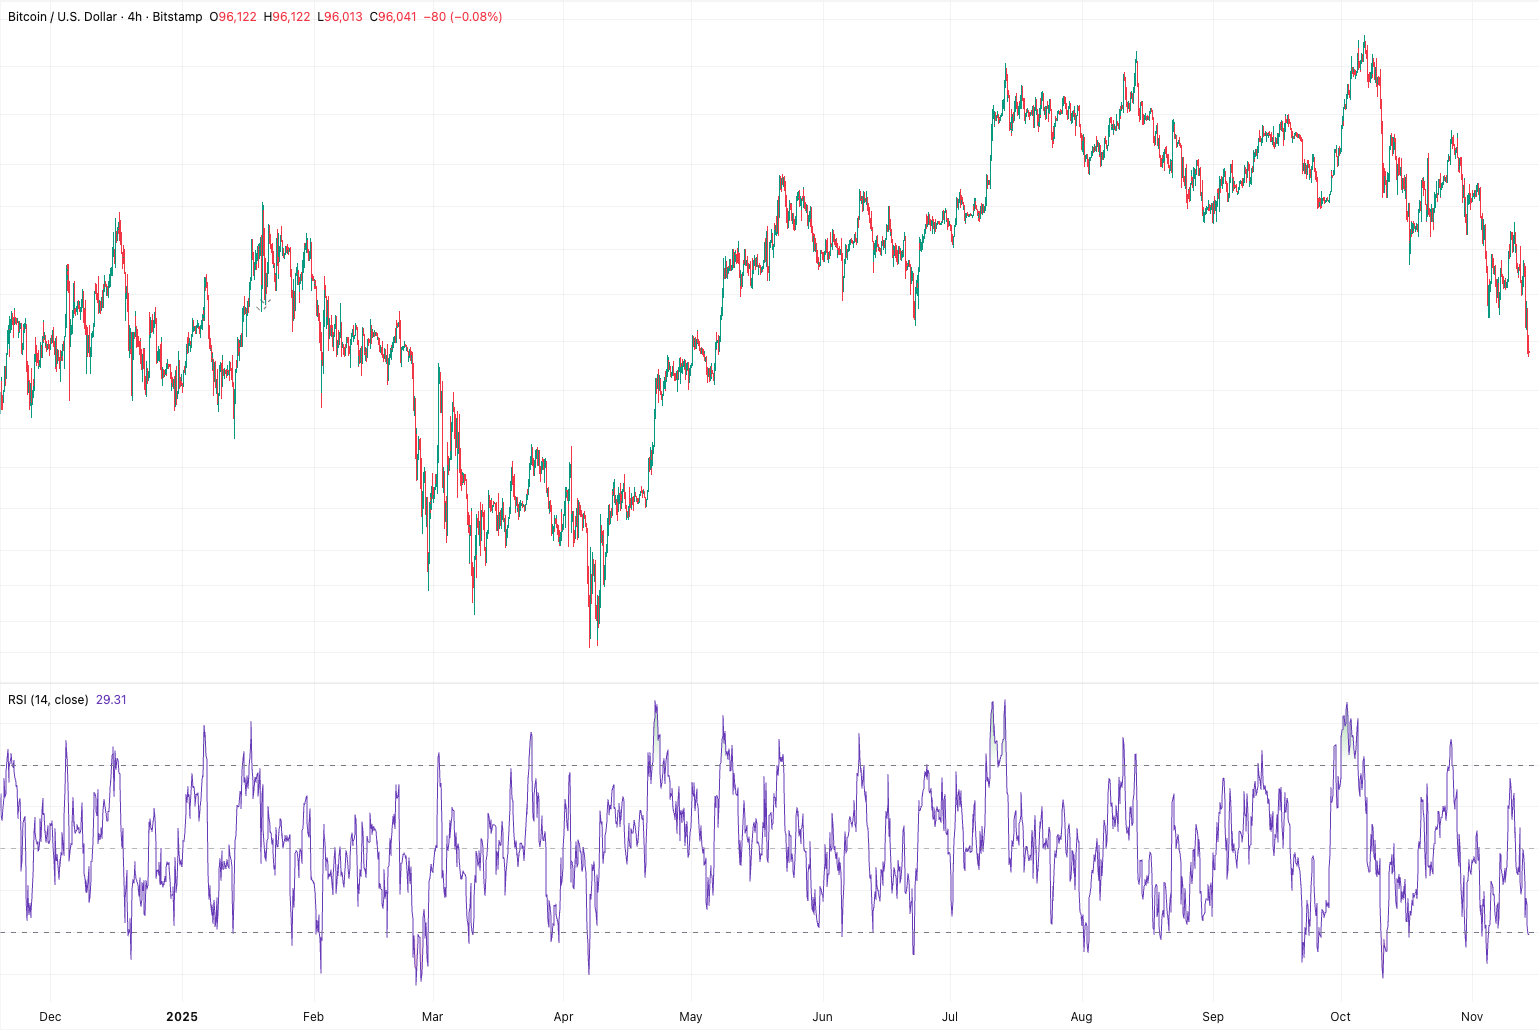
Friday Chart Check
Bitcoin

Friday’s chart is Bitcoin on the four hour interval, a lens that captures the short term pressure building across risk markets. The structure has shifted into a clean sequence of lower highs and lower lows, with each rebound failing at a declining trend line. Momentum remains negative and the break below one hundred thousand dollars confirms a near term downtrend that now points toward the ninety six thousand to ninety four thousand support cluster.
But the more important point is perspective. On the daily chart Bitcoin is still holding above its rising fifty day moving average and the broader channel that has guided price action since spring remains intact. The weekly view is even clearer with a series of higher highs and higher lows that define a durable uptrend. In other words the four hour weakness shows traders reducing exposure in a stressed tape but the larger structure does not yet resemble a trend break.
The message for traders is that smaller time frames often exaggerate fear and momentum. The four hour chart captures the current liquidation cycle but the daily and weekly charts still show a market that has trended higher all year. A sustained reclaim of the one hundred thousand level would stabilize the short term picture. Until then the bias on the lower time frame remains downward while the higher time frames continue to argue that the primary uptrend is not broken.